A Level of Service (LOS) chart for park facility recommendations can be found on pages 241-243 of the draft report for the Public Spaces Master Plan (draft).
This LOS report does not take into account total parkland comparisons, which help to contextualize the information. For example when recommendations for facilities are put into a real-world constraint like total parkland this shows whether the recommendations are reasonable or even feasible with the size of our park system compared to other park systems.
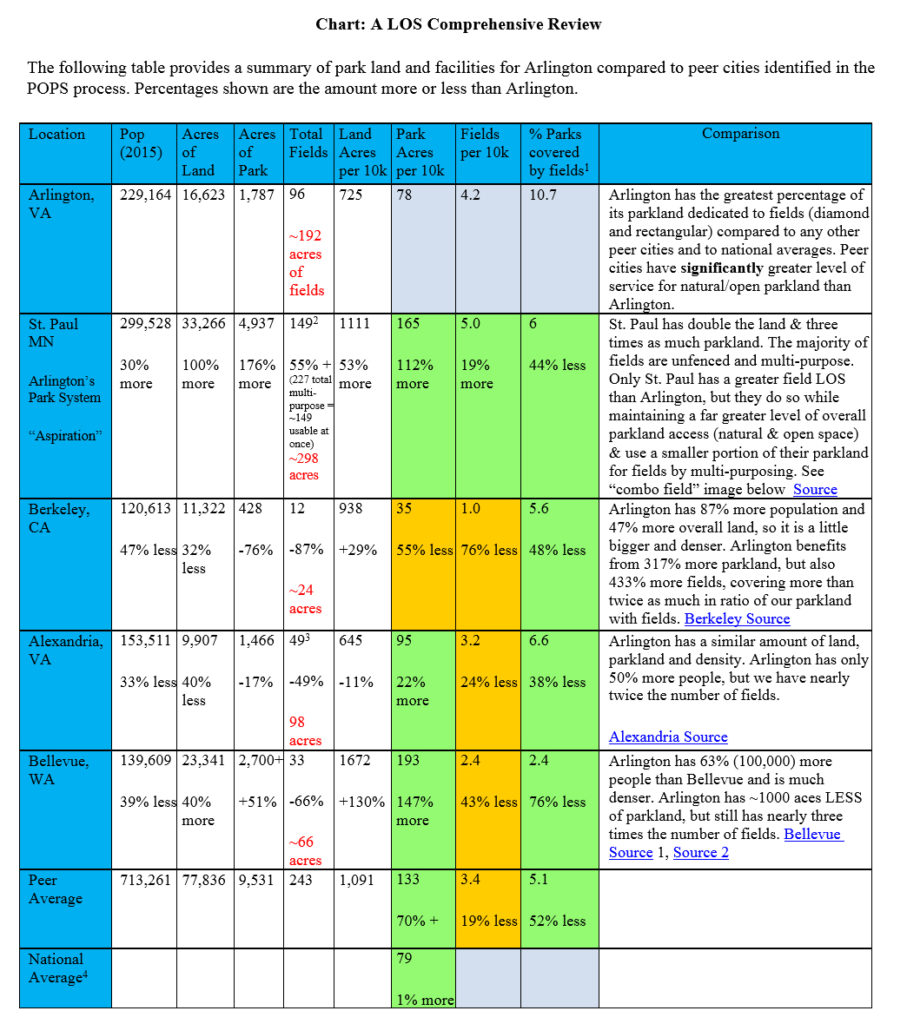
The findings with total parkland added into the Level of Service Chart show:
- Access to overall parkland is much lower in Arlington (78 acres per 10,000 residents) than in peer cities (average of 133 acres per 10,000), and even less than the national average (79 acres per 10,000).
- Further, the percentage of parkland devoted to fields is much higher (10.7%) in Arlington than in peer cities (5.1%). Arlington residents have, in most cases, significantly higher access to fields (4.2 fields per 10,000 residents) than residents of peer cities (average 3.4).
Arlington’s Level of Service Chart (draft report Public Spaces Master Plan)
![]()
A revised LOS chart with parkland totals added.
Key for LOS Comprehensive Chart
Total Parkland: Using Trust for Public Land information and information from each of these peer cities government websites, we aggregated total parkland. Arlington’s report of its total parkland contains numerous inconsistencies. Internal reports from the consultant’s benchmarking showed Arlington’s parkland at ~ 900 acres, while the POPS report states “Arlington has over 2,000 acres of parkland, both County- and non-County owned, that represent the heart of the public space system” page 44. For consistency with other cities and using a real numerical value, we used Trust for Public Land’s data of 1787 acres Trust for Public Land’s 2017 City Park Facts.
1 Using general estimate of 2 acres per field (POPS also uses this 2 acre field estimate). All locations appear to include school fields in their count, so the number may be larger than actual park coverage, but is still reasonable for relative comparisons.
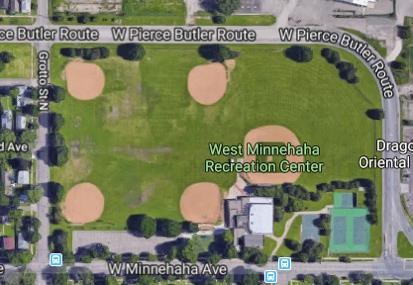
2 St Paul has 227 total fields (GIS). However, virtually every field is a combination or overlap, so estimating 66% (149) could be used at any time. For example, St Paul recreation center shown hosts 8 fields: 4 softball, 1 baseball, 2 soccer, and 1 football
.
3 Using official Alexandria count of 49. Alexandria parks viewer actually identifies 55 (including 16 school fields).
4 For jurisdictions between 100k and 250k, according to National Recreation and Park Association’s (NRPA) 2017 Agency Performance Review.